Ensemble Multistage

Operational, seven-member ensemble-based coastal wind, wave, and water level guidance is presented here for the East Central Florida Coast with high resolution in the Indian River Lagoon and Brevard County. These predictions were made by the physics-based ADCIRC+SWAN numerical model using NOAA’s North American Mesoscale (NAM) model, the Global Ensemble Forecast System (GEFS), and Short-Range Regional Ensemble Forecast (SREF) system.
Click here to see the software map
Ensemble-Multistage was developed for the express purpose of hydrodynamic predictions. To better represent the uncertainties in the atmospheric forcing, winds and pressure are obtained from a deterministic high-resolution regional weather forecast model (NAM: North American Mesoscale), and six statistical analyses -- three from an ensemble high-resolution regional weather forecast model, SREF (Short Range Ensemble Forecast), and three from a global ensemble lower-resolution weather forecast models, GEFS (Global Ensemble Forecast System).
In Multistage, conventional one-way nesting is applied within the framework of an unstructured ADCIRC model to improve computational efficiency. The coastal circulation characteristics are calculated by the ADCIRC model while the wave is forecast by the Simulating WAve Nearshore (SWAN) model which is tightly coupled to the ADCIRC model.
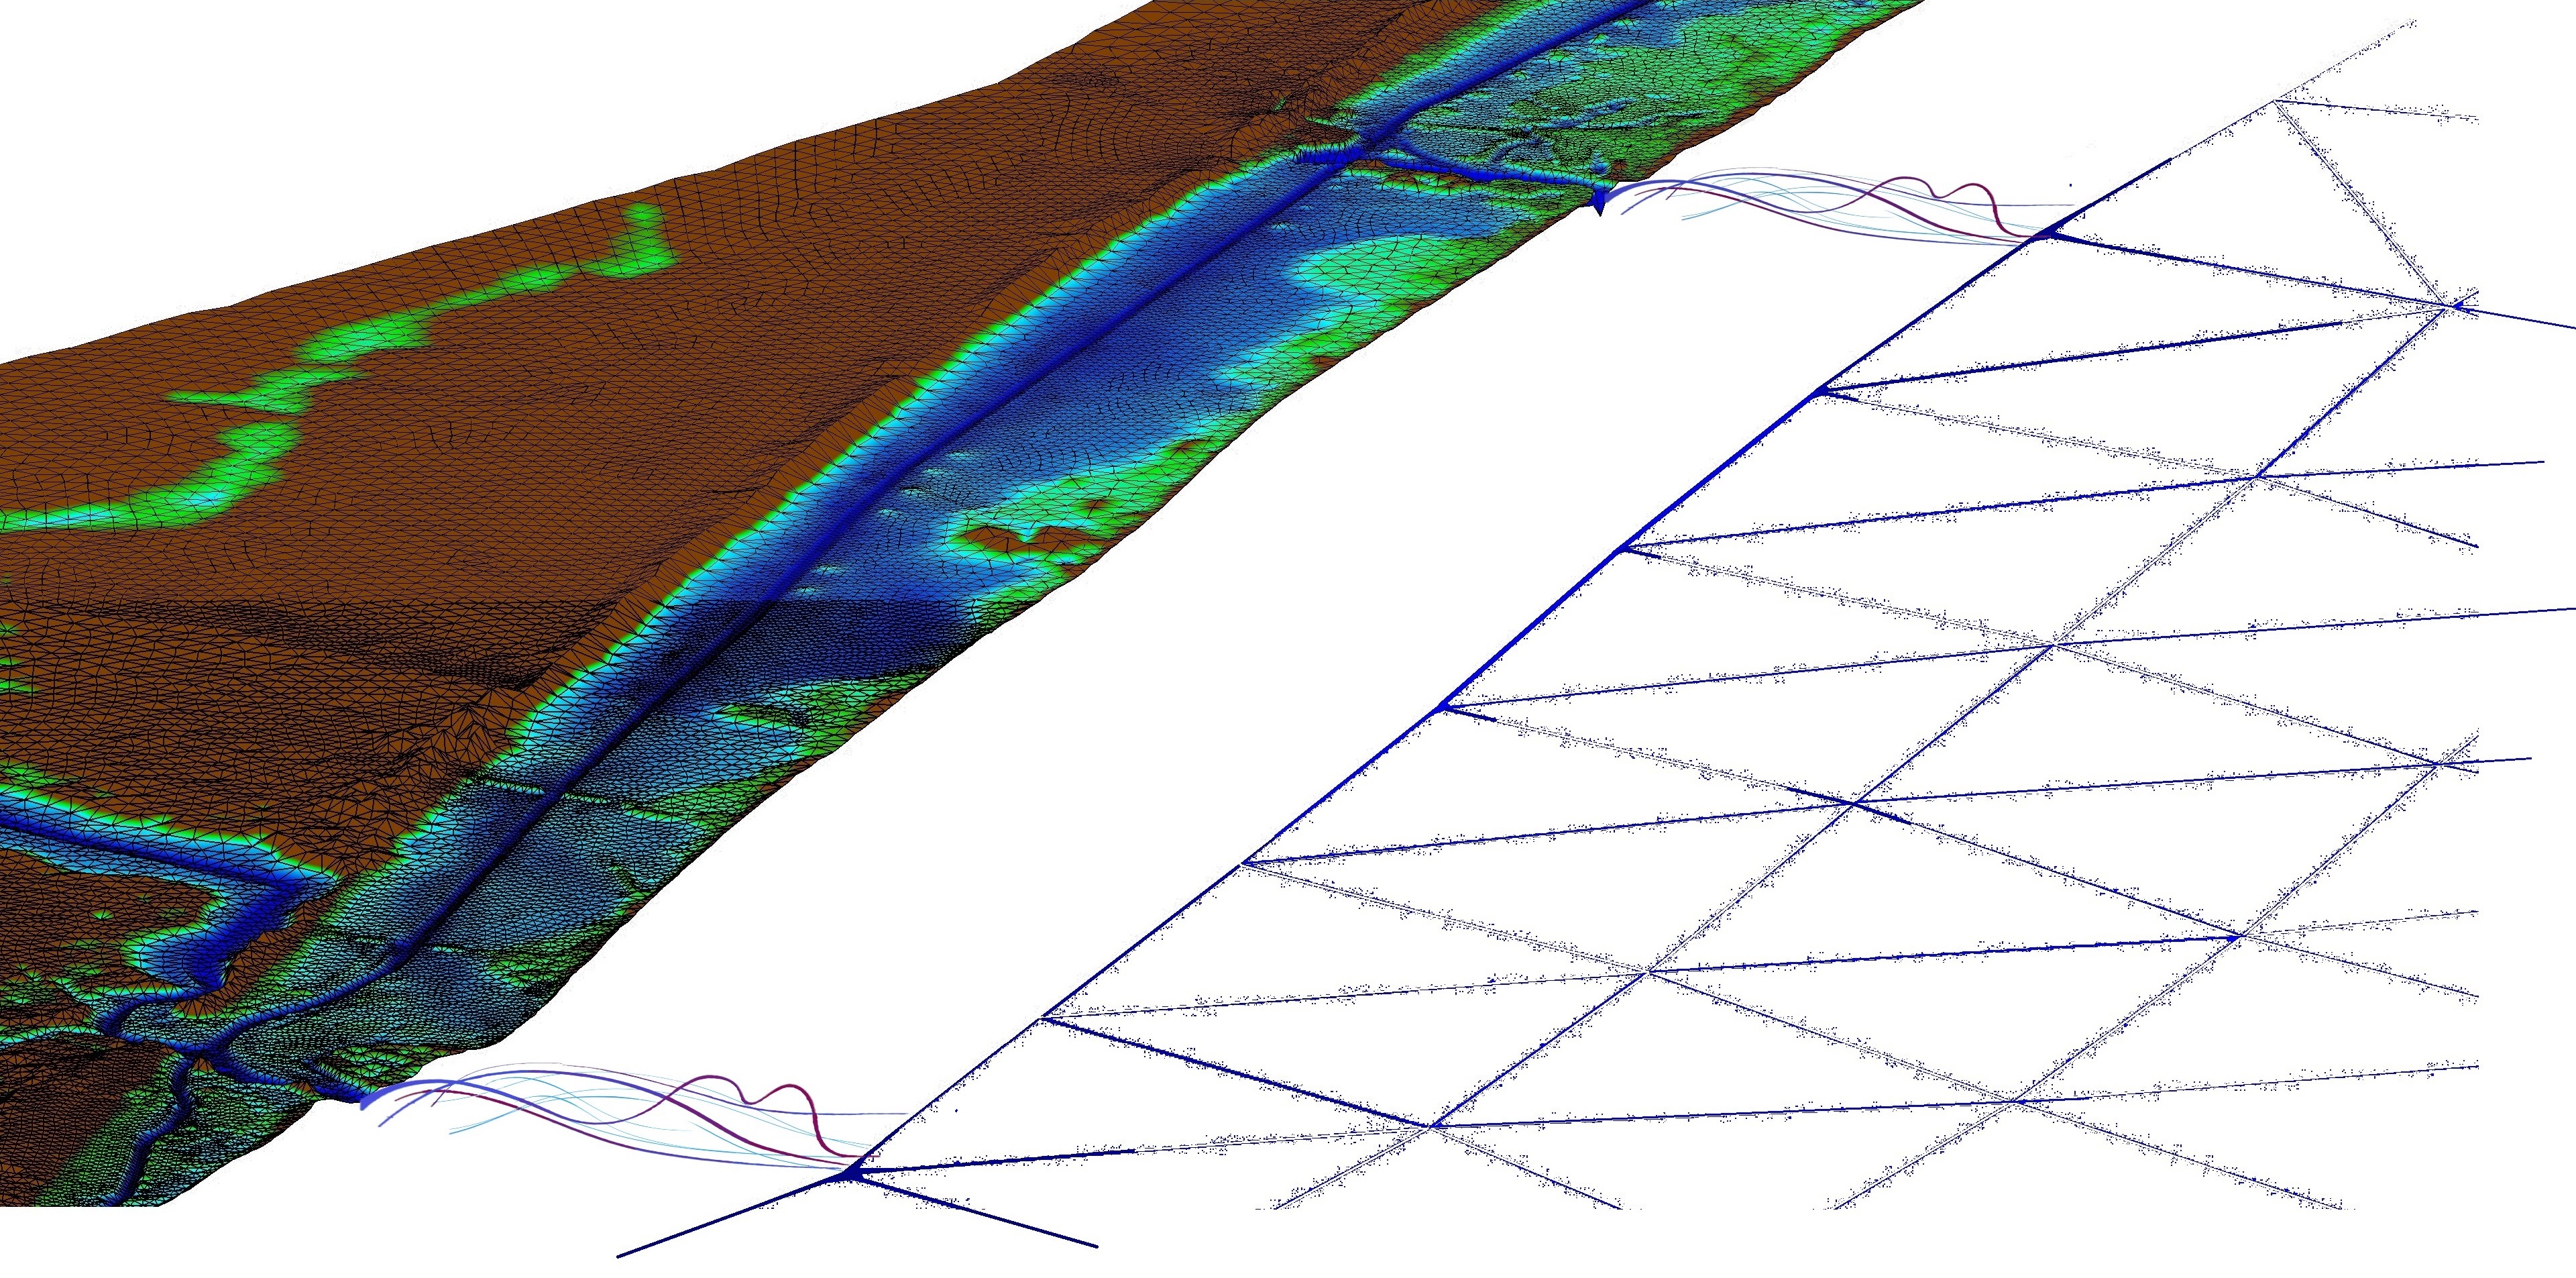
The FE-based unstructured coarse mesh consists of approximately 40,350 nodes encompassing the western North Atlantic Ocean, the Caribbean Sea, and the Gulf of Mexico. An open boundary is located at 60°W in the deep Atlantic Ocean. The coarse mesh has a maximum grid spacing of roughly 9 km in the deep Atlantic Ocean and a minimum of 900 m at IRL inlets and around the Caribbean and Bahamas Islands. A nested unstructured fine-scale high-resolution mesh consisting of 126,770 nodes represents the entire IRL and the proximity low-lying land. The fine-scale mesh resolves most of the complex geometry inside the lagoon with a minimum grid spacing of 15-30 m near the causeways and relief conveyances, creeks, as well as the channels that pass through residential communities. Larger grid spacing on the order of 100-600 m is used for inland regions.
For each forecast cycle, a six-hour nowcast is performed using the NAM analysis. Since these short simulations are forced by analyses, it eliminates the need for multiple runs under different atmospheric conditions. The NAM is preferred over that of GEFS as it features higher spatial resolution (12 km vs 0.5°) as well as the SREF whose products are available but the model has a cycle offset of 3 hours.
The 6-hour nowcast is then used to initialize a 3.5-day forecast. NAM files are retrieved and processed using sub-programs of the ADCIRC Surge Guidance System (ASGS) that are embedded in Multistage. SREF and GEFS files are downloaded and processed by modular software programs developed in this work. The workflows of these modules are initiated by downloading GRIB2 files and extracting U and V components of forecast winds at 10 m above mean sea level as well as forecast sea surface pressure. For each ensemble model (SREF and GEFS), the mean and standard deviation of U and V wind components are separately calculated. The mean and standard deviation of the sea surface pressure is also calculated. Three distinct wind and atmospheric pressure forcing grids at 3 hourly resolution are generated from 13 members of SREF, and three forcing grids are created from 21 members of GEFS. Calculating the mean and standard deviation of the U and V components separately creates variations of wind directions within the generated wind forcings.
FigureGen is a FORTRAN program that acts as an interface between the SWAN+ADCIRC simulation files and the resulting illustrations . FigureGen is incorporated within the Ensemble-Multistage, and it is used to visualize forecast guidance. The visualization cores read the SWAN+ADCIRC files, convert the data into appropriate formats, and then call the GMT tools to generate contours, vectors, etc. Command-driven interactive plotting program; gnuplot, is also used to plot times series results at specific locations.
The Ensemble-Multistage is run on a research computer with 48 CPUs from which 46 processes are taken by the models. The wall-clock time is less than 8 hours to complete the entire forecast run, from input preparation to result visualization and publication. A secondary computer with 6 CPUs is set up and networked to the main computer for the purpose of generation of animated results, as this process is time intensive. Creation of four animations take one hour by running FigureGen in parallel. Serial run would take longer time.